Case Study
Quantum Algorithm & Simulation Engineering
A production-oriented benchmark suite for quantum software engineering: simulator benchmarking, noise scaling, gradient variance behavior, and transpilation effects.
At a Glance
Key Metrics
Artifacts
4 experiments
Benchmarking + Analysis
Grid Sweep
5 x 5
Qubits x Depth, K=20 trials
Key Finding
Slope sign flip
Tied vs Untied params
Methodology
Config-driven
Deterministic seeds + CI
TL;DR
Summary
Built a reproducible quantum benchmarking suite with four interview-ready artifacts: gradient scaling (tying vs untied), backend benchmarking (Qiskit vs custom), shot-noise scaling (error vs runtime tradeoffs), and transpilation optimization. Everything is config-driven, trial-level logged, and produces publication-style plots.
Background
Context
Quantum software engineering requires rigorous benchmarking methodology. This project builds production-quality experimental infrastructure for answering quantitative questions about quantum algorithms: How does gradient variance scale? What are the real runtime-accuracy tradeoffs? How does transpilation affect circuit depth?
Each artifact is designed to be reproducible, auditable, and interview-demonstrable.
Experiments
Four Artifacts
Backend Benchmark
Qiskit vs Custom
Benchmarked runtime and expectation accuracy across circuit families, observables, exact/shot modes.
Custom adapter interface for stable benchmark API. Compares Qiskit Aer with a from-scratch statevector backend under identical workloads.
Click to expand
Noise & Shot Scaling
Error vs Runtime
Statevector exact as reference, qasm-shot estimator across regimes.
Threshold guidance: shots needed for mean_abs_error < 1e-2 with runtime at crossing. Maps the Pareto frontier of accuracy vs compute.
Click to expand
Gradient Variance Scaling
The Star Artifact
Measured log(mean_G) vs n_qubits under matched grid (n=[4..12], d=[2..10], K=20).
Parameter-shift rule, IQP circuits, Z0 observable, statevector exact. Key finding: tied parameters show positive slope, untied show negative (sign flip).
Click to expand
Transpilation Optimization
Gate Cancellation
Gate cancellation and rotation merging across optimization levels.
Depth before/after comparison shows diminishing returns at higher optimization levels. Quantifies the transpiler's actual impact on circuit depth.
Click to expand
Star Artifact
Gradient Variance Scaling
Measured log(mean_G) vs n_qubits under a matched grid: n=[4,6,8,10,12], d=[2,4,6,8,10], K=20 trials per configuration. Uses parameter-shift rule, IQP circuits, Z0 observable, and statevector exact backend.
Slope by Circuit Depth (Tied Parameters)
Bar width proportional to slope magnitude. Intensity reflects R2 fit quality. d=8 has a subtle pulse (highest slope).
| Depth | Slope | R² |
|---|---|---|
| d = 2 | 0.259218 | 0.9397 |
| d = 4 | 0.259179 | 0.9776 |
| d = 6 | 0.280629 | 0.9762 |
| d = 8 | 0.334382 | 0.9834 |
| d = 10 | 0.312585 | 0.9619 |
Sign Flip: Tied vs Untied Parameters
Tied (global_shared)
Positive slope --- variance grows with qubits
Untied (none)
Negative slope --- barren plateau behavior
Key insight: Parameter tying fundamentally changes gradient scaling behavior. Tied parameters produce a positive log-variance slope (variance increases with qubits), while untied parameters exhibit the classic barren plateau (variance vanishes exponentially).
How
Methodology
Frozen Experiment Contracts
Randomness Axes Separation
Metric Definitions
CI Strategy
Depth
Technical Ownership
Randomness Axes Separation
Explicit control over structure, parameterization, and sampling. Each axis is independently freezable for isolation and debugging.
Fit-Quality Checks
R² validation plus sanity-oriented schema and output checks. Every linear fit includes a quality metric so spurious results are flagged automatically.
Reference vs Estimator
Exact statevector reference paired with shot-based estimators. Every experiment has a ground truth baseline, not just relative comparisons.
Config-Driven Reproducibility
YAML configs, deterministic defaults, auditable outputs. Any result can be reproduced by re-running the config file with no manual steps.
Authorship
Role
Sole author. Designed the architecture, implemented all 4 artifacts, created the benchmarking CLI, and produced the analysis reports.
Future
What I'd Do Next
Scale gradient experiments to larger qubit counts (14, 16) to test whether positive slopes persist beyond current grid.
Add hardware noise models from real backends (IBM Quantum, IonQ) to compare simulator fidelity with actual device behavior.
Implement custom transpiler passes and measure their impact on variational algorithm convergence rates.
Benchmark against Cirq and Pennylane backends to establish cross-framework performance baselines.
Benchmark Suite
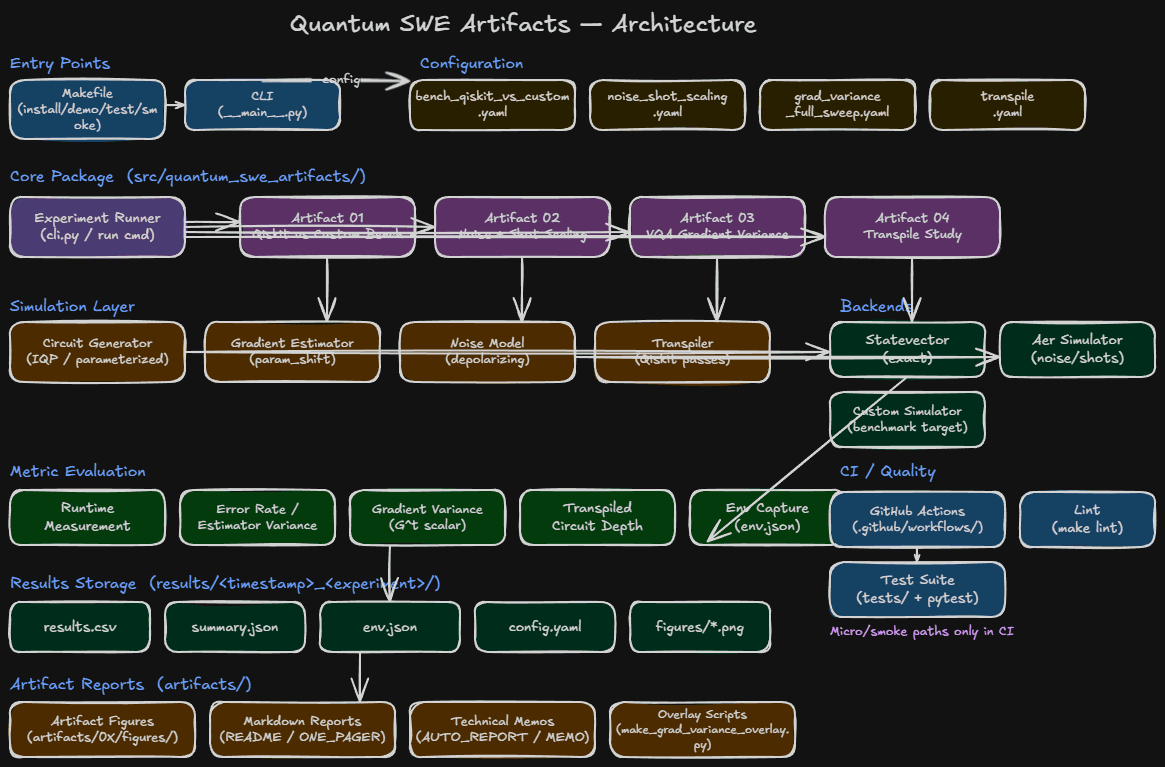
Architecture Diagram
Shared config parameters flow through circuit generation, dual backend execution (Qiskit Aer + custom statevector), a central harness, then fan out to four independent artifact experiments — each producing reproducible, exportable results.